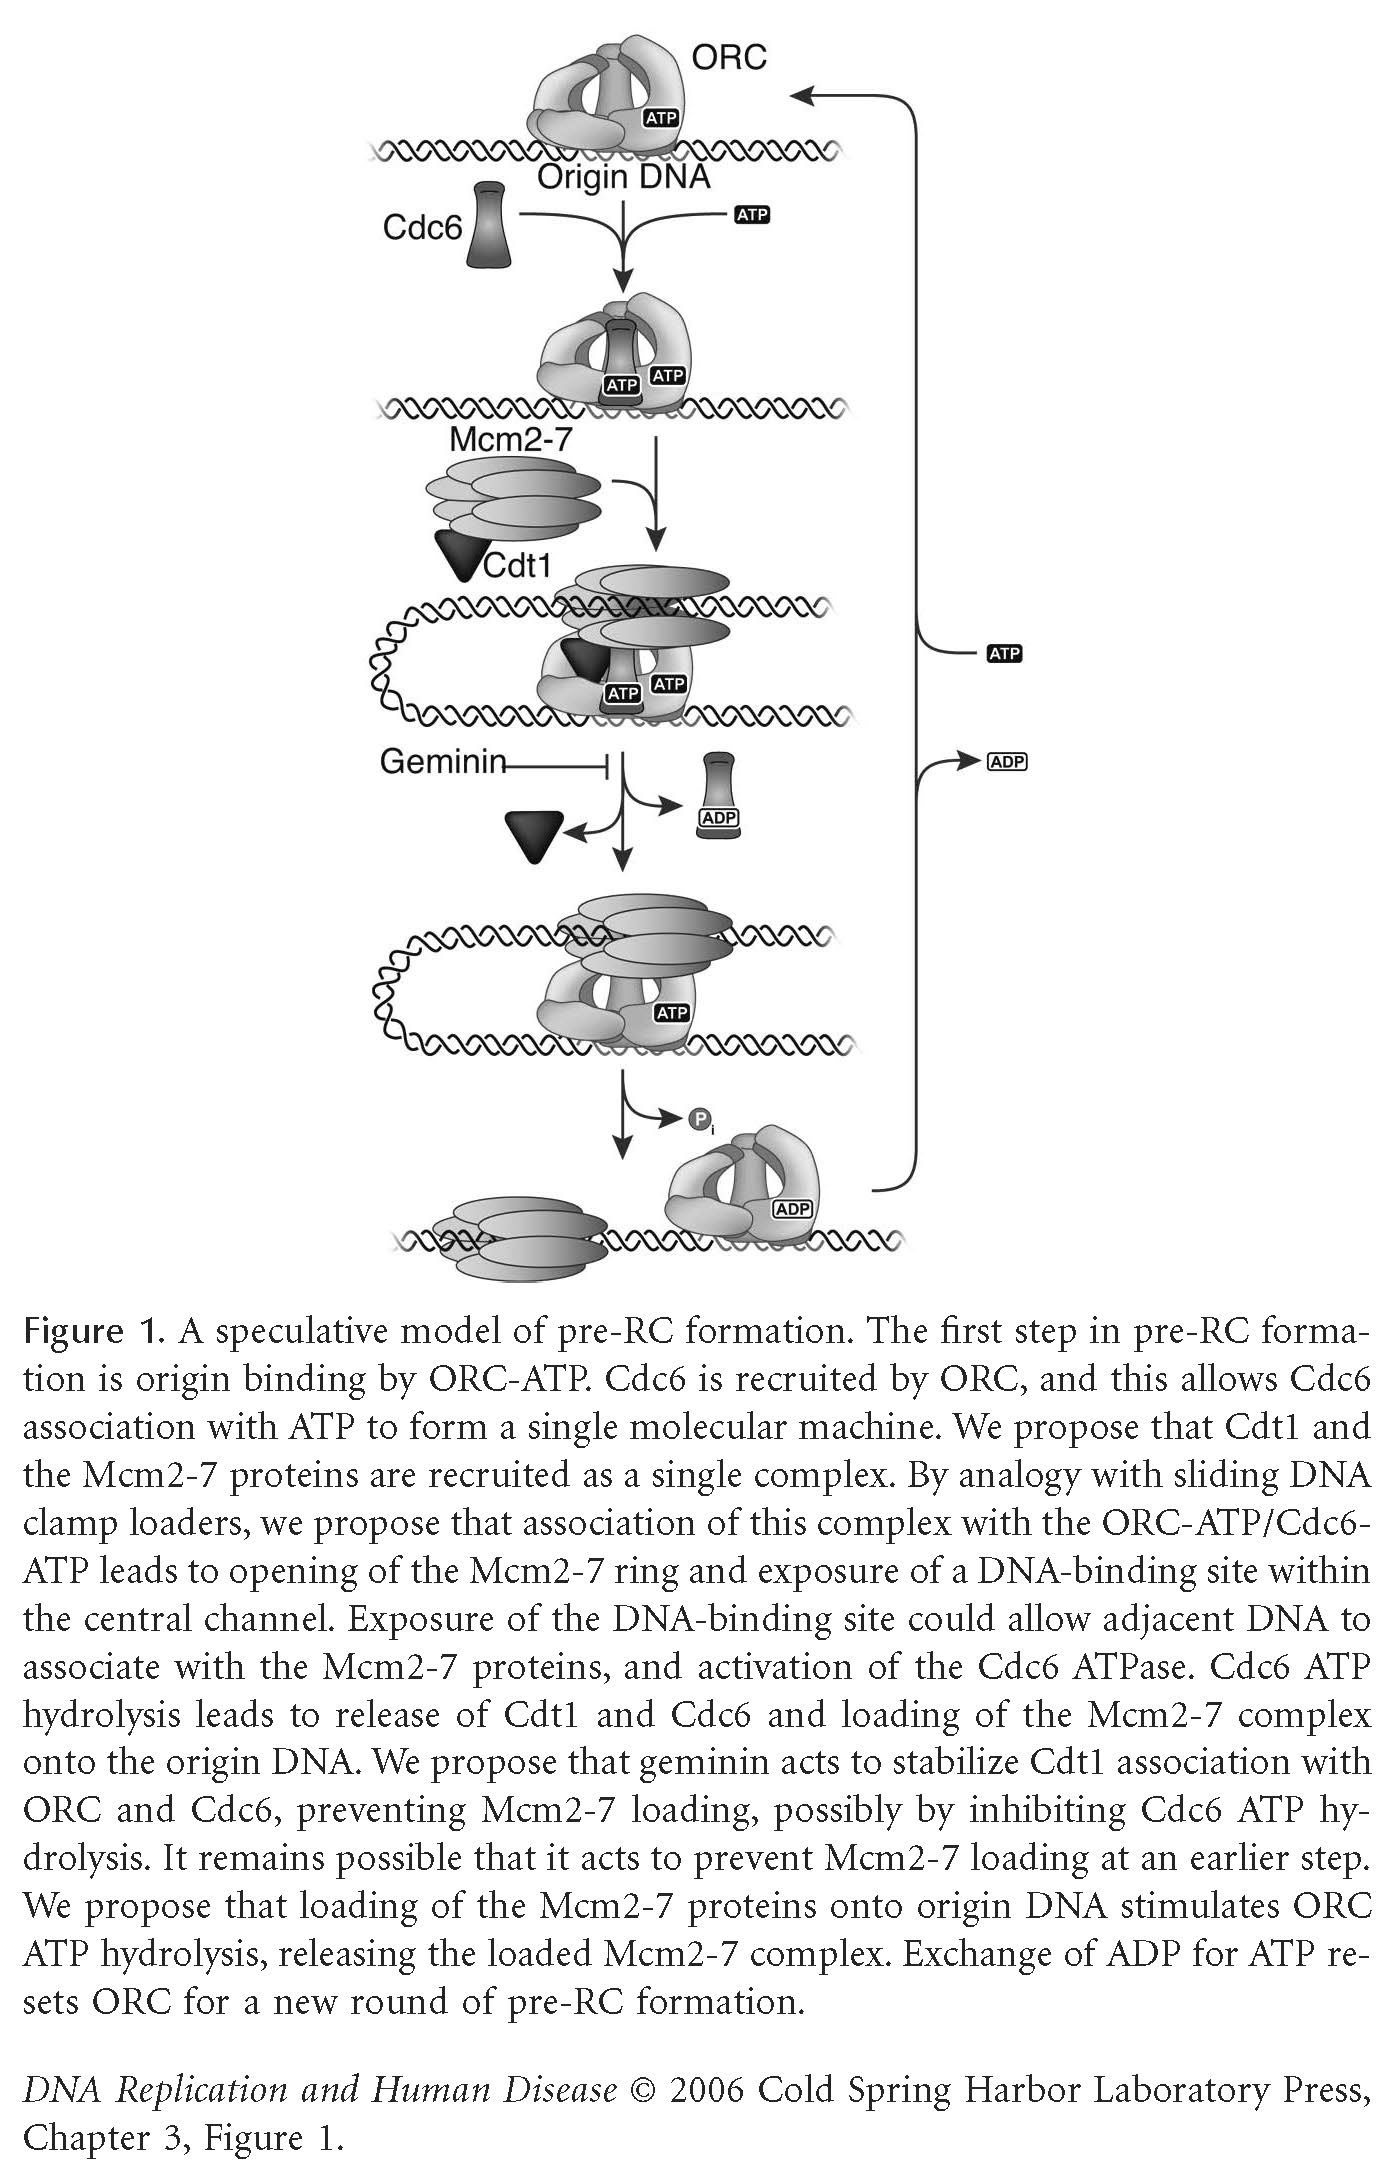
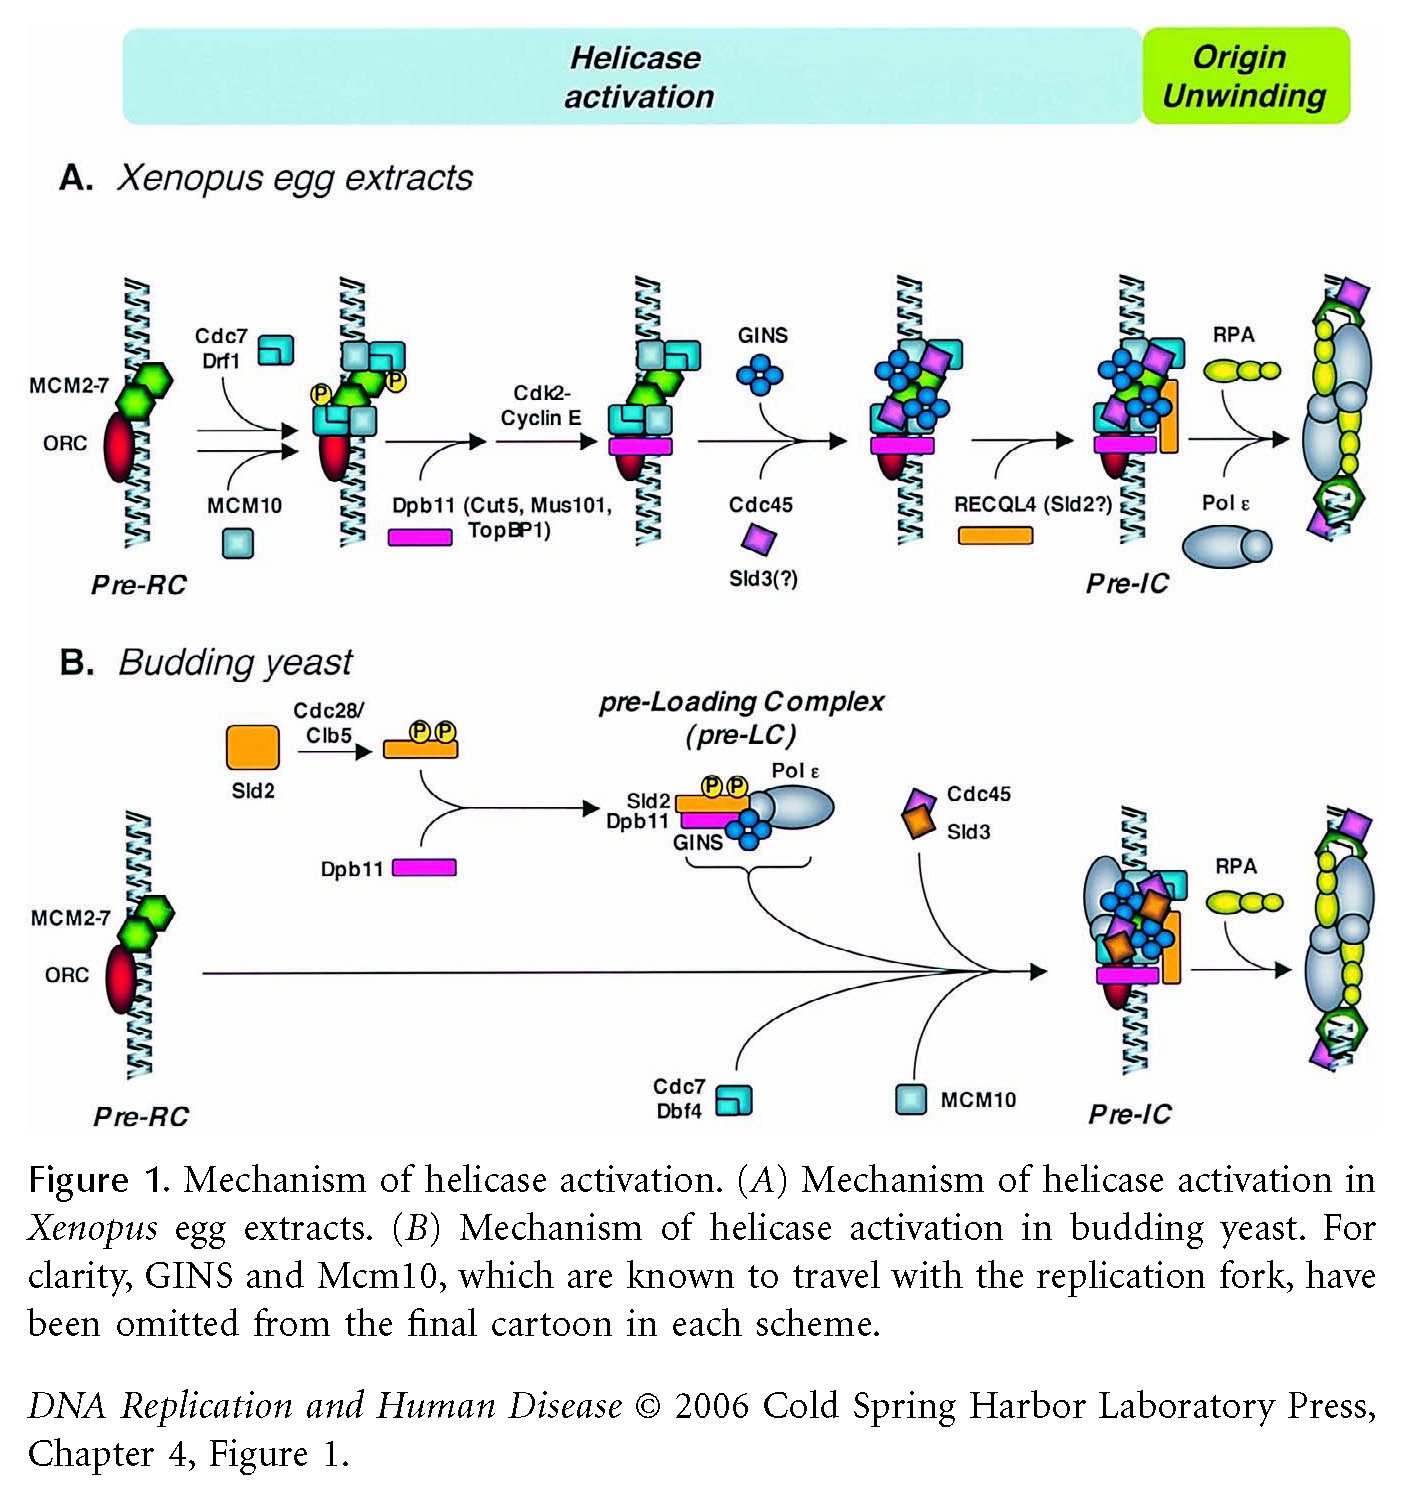
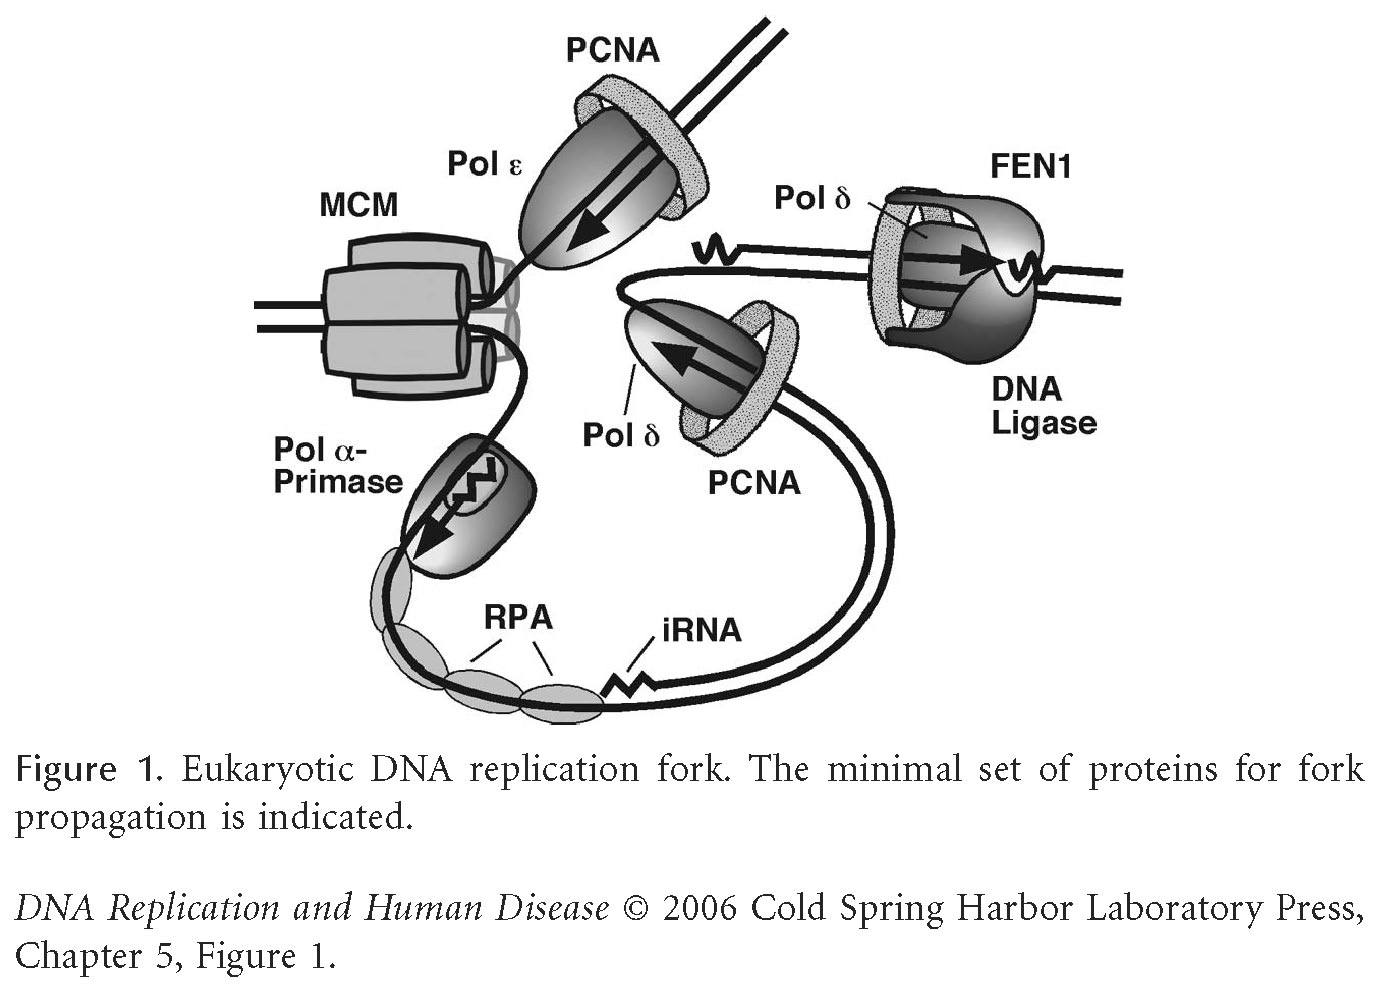
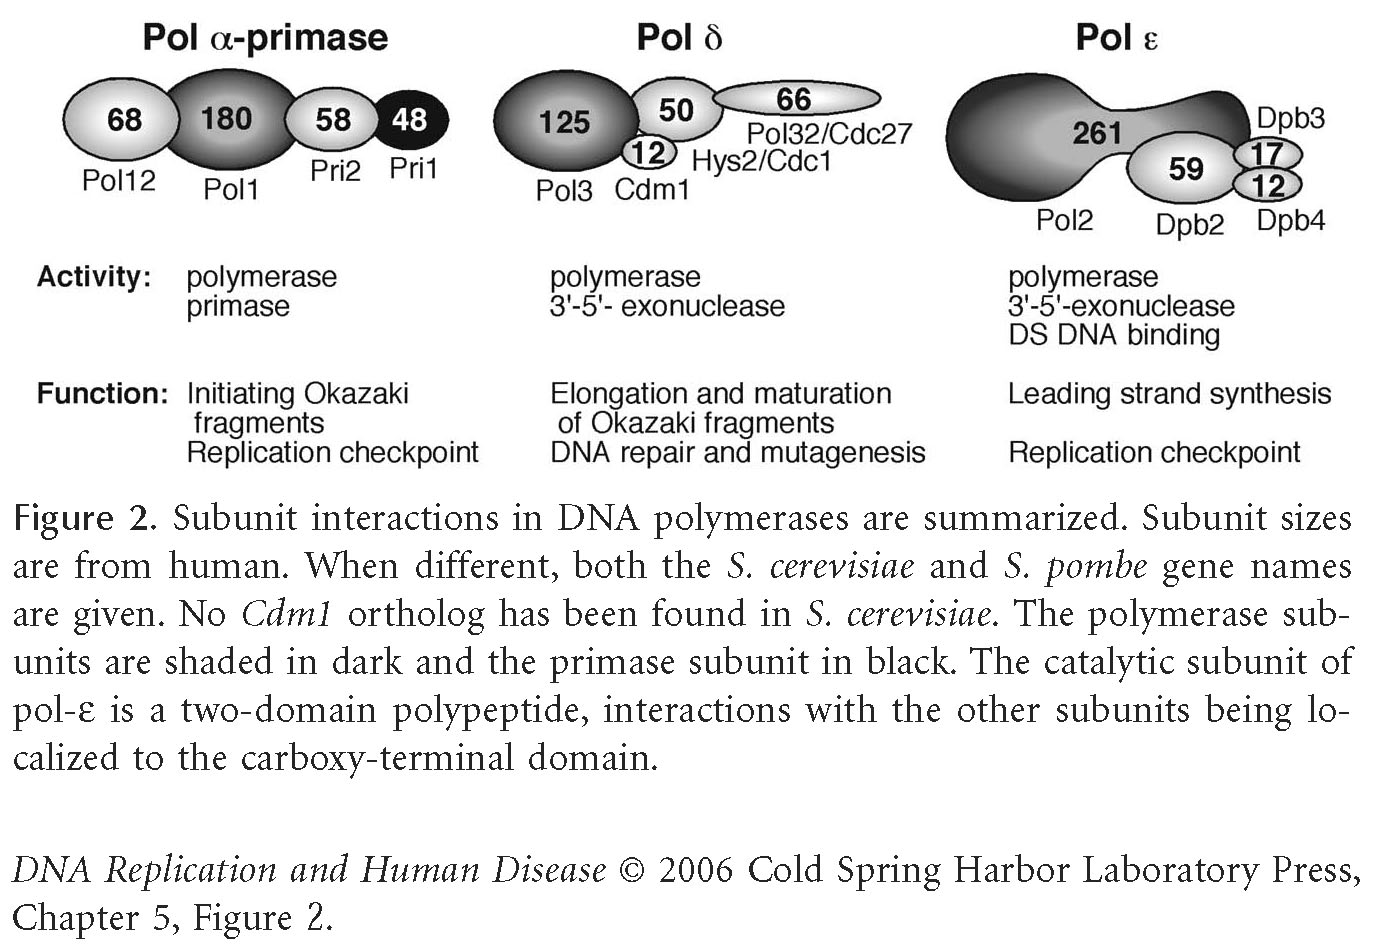
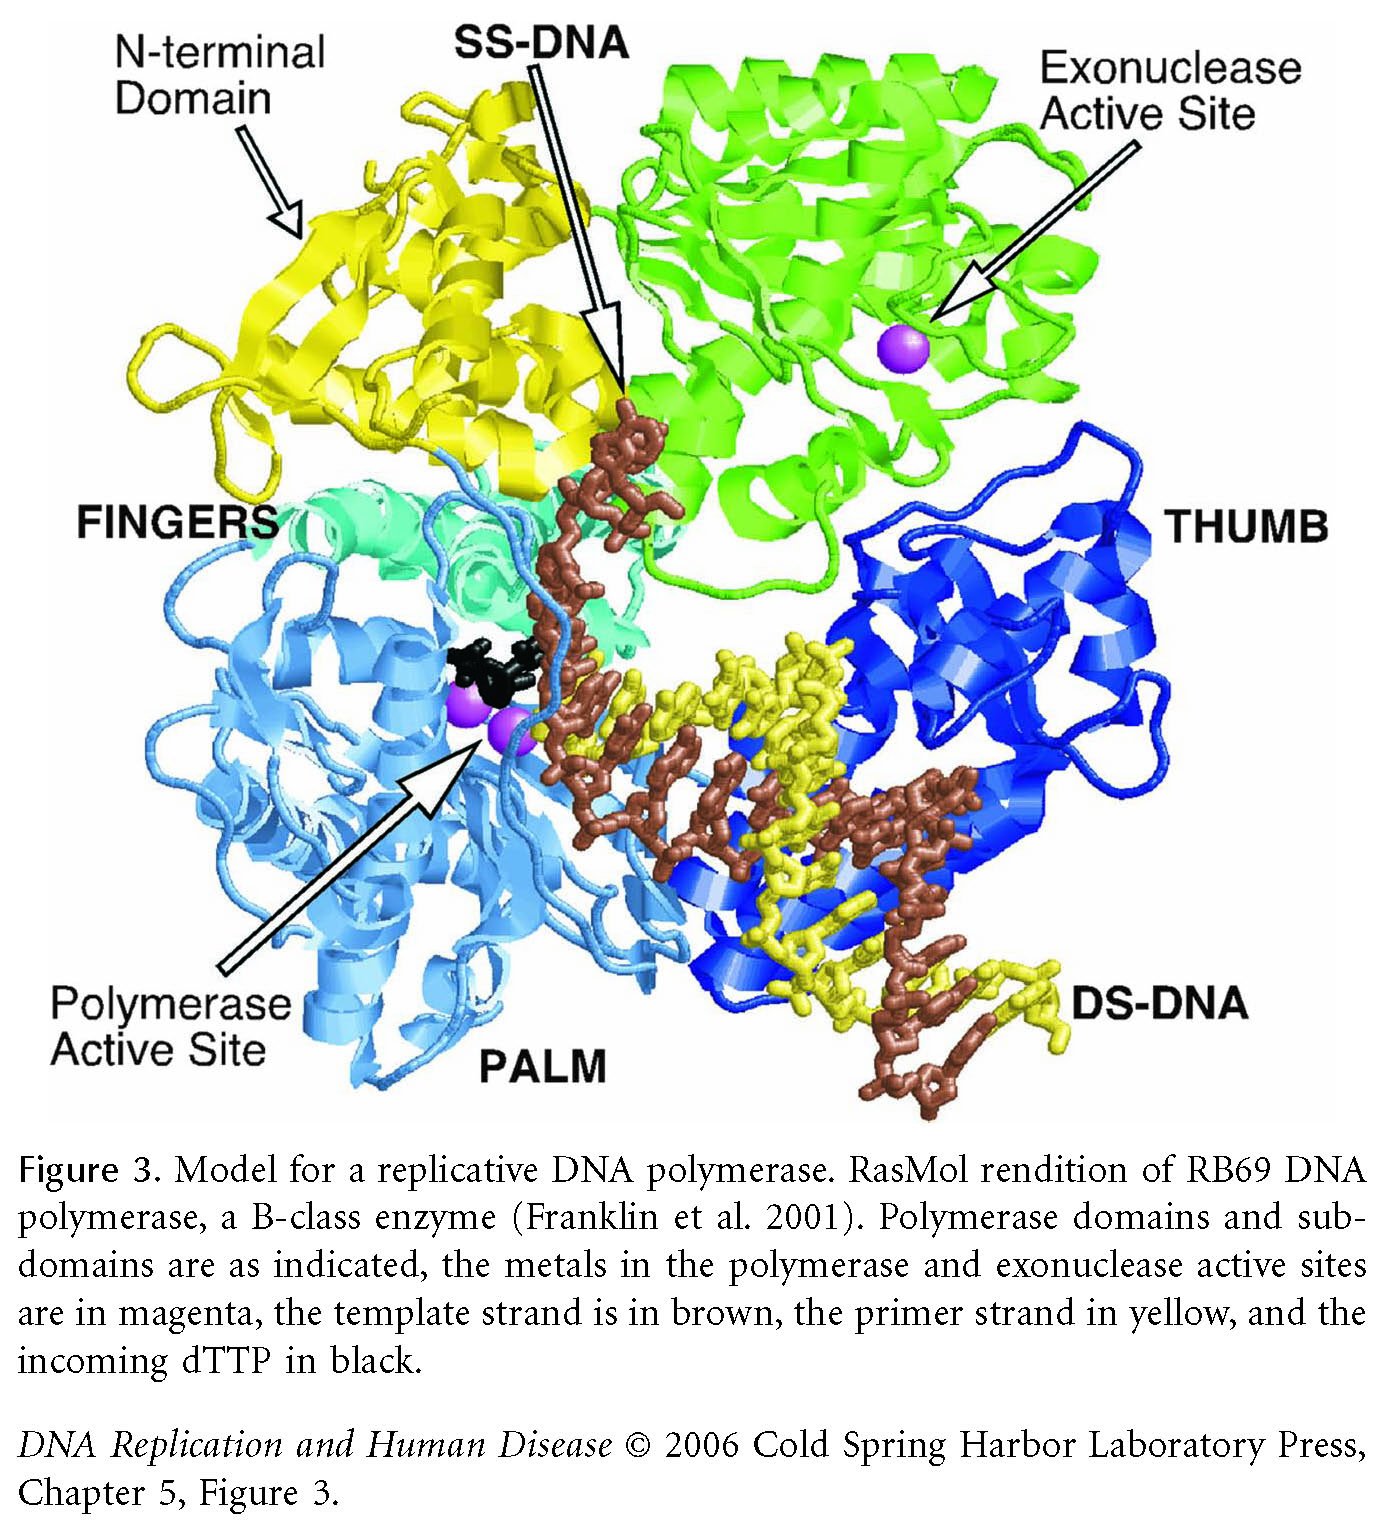
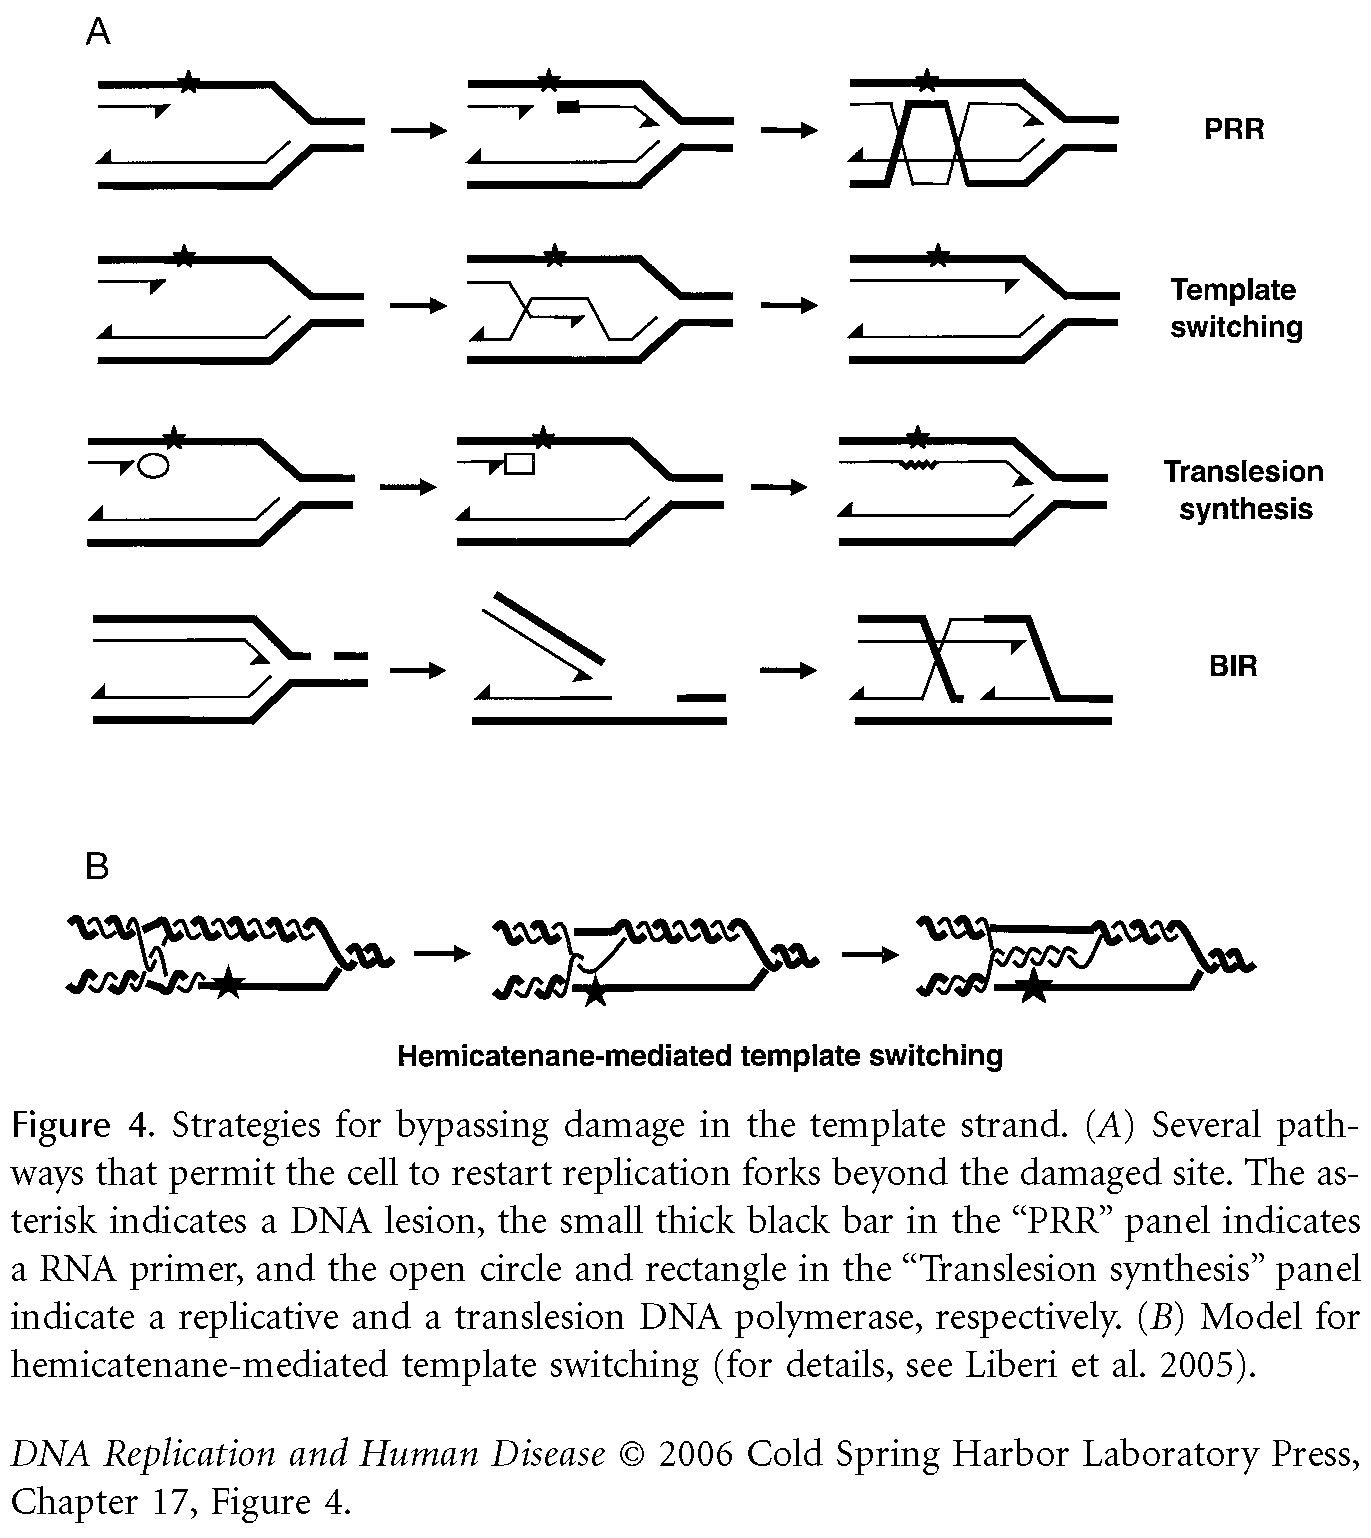
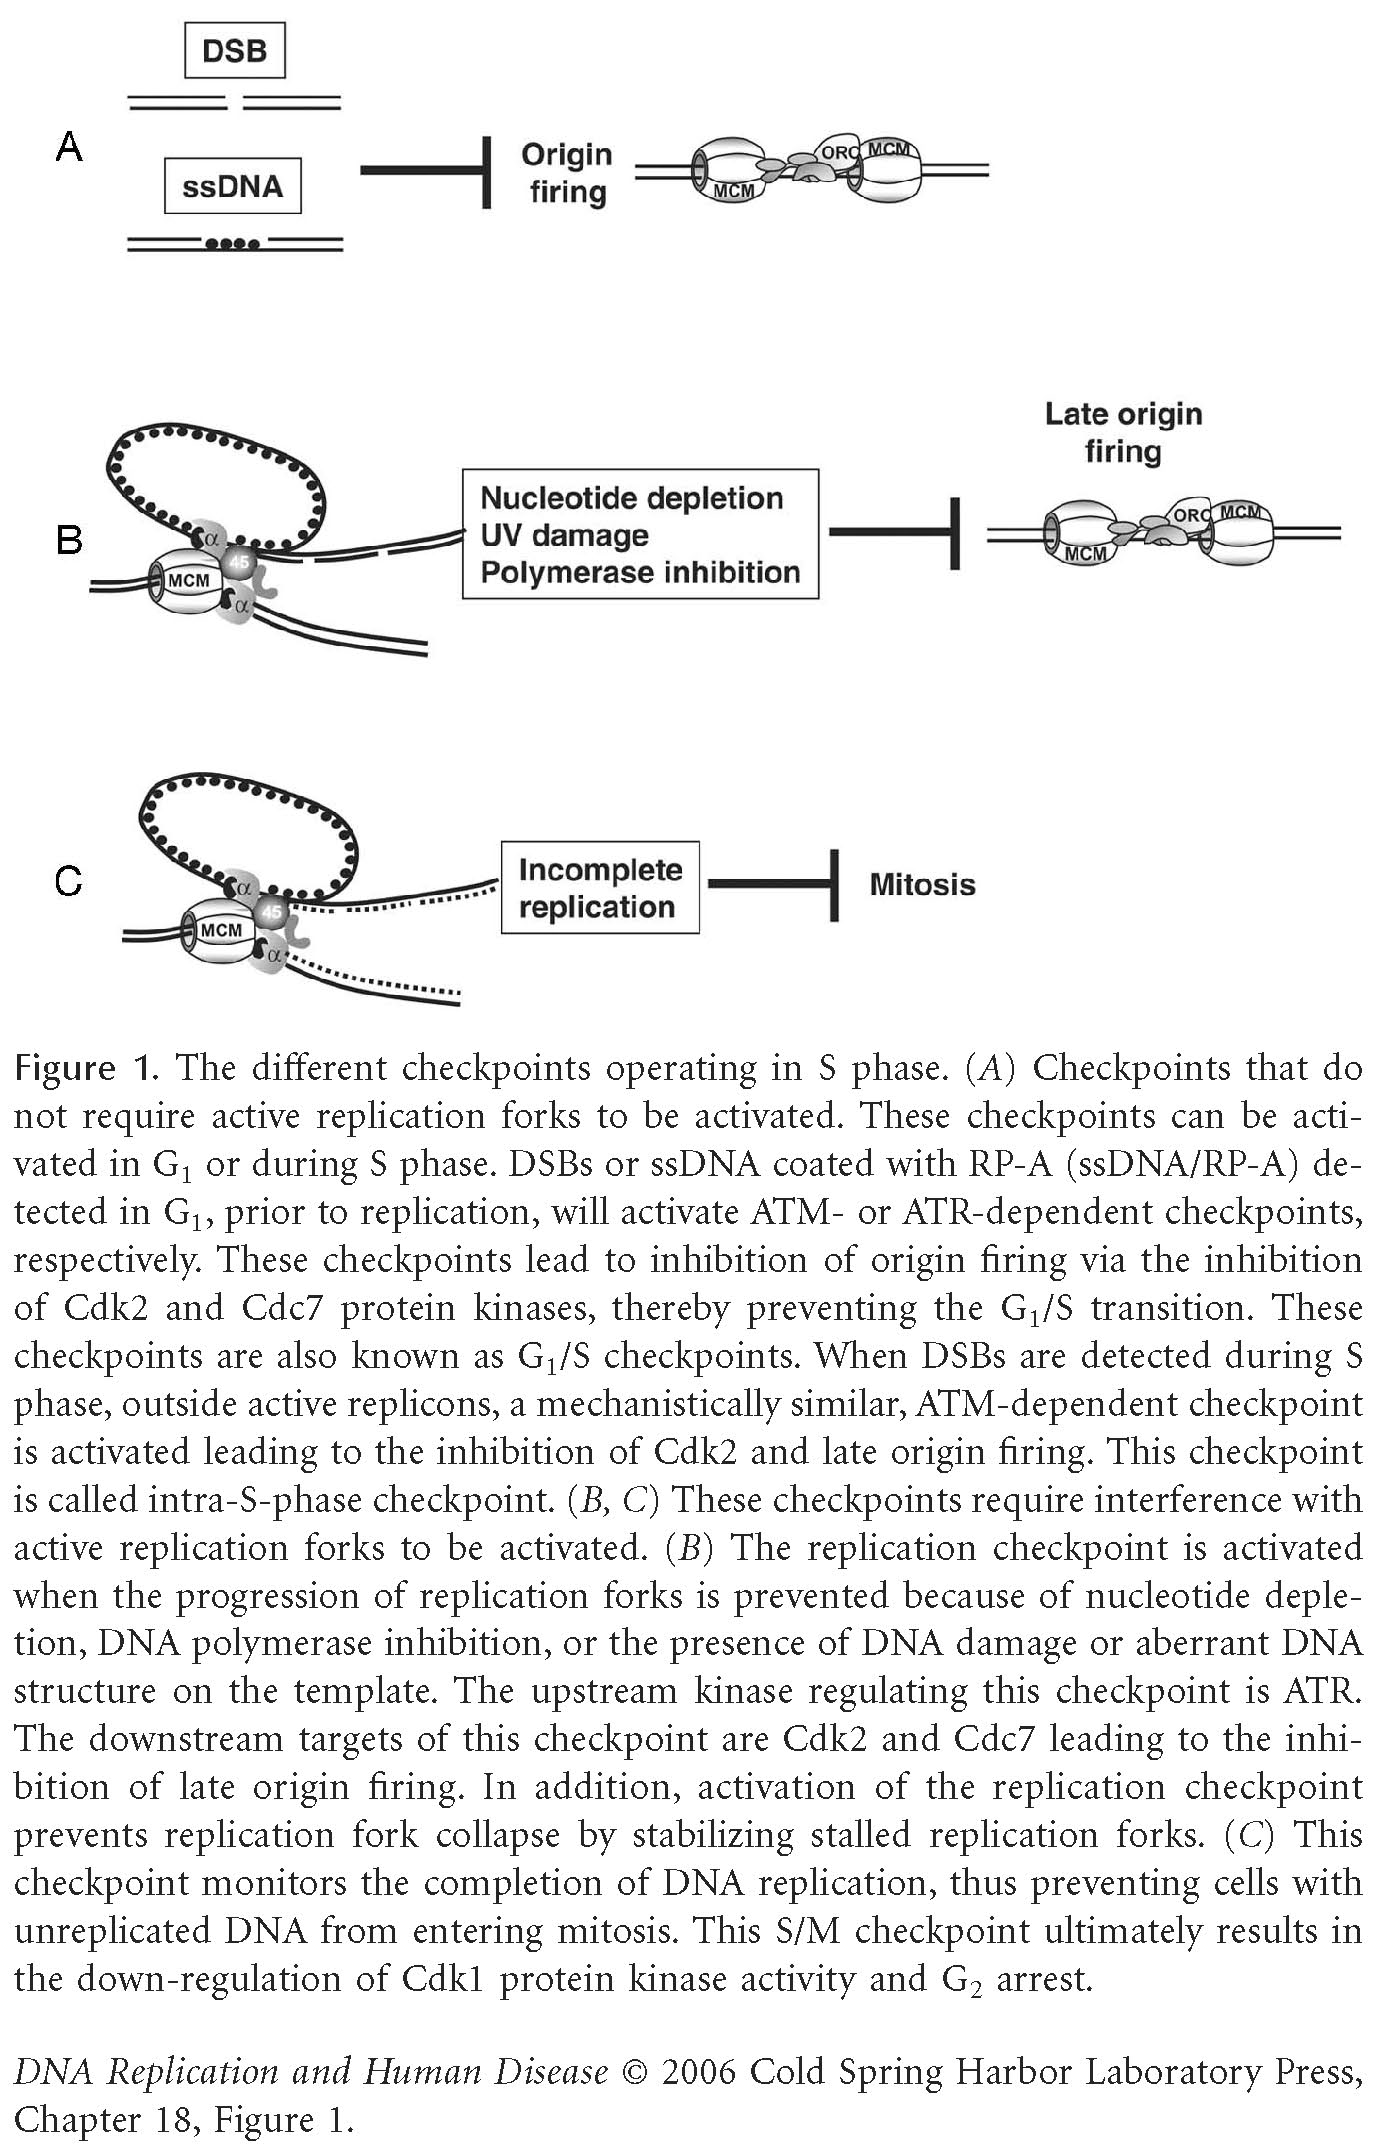
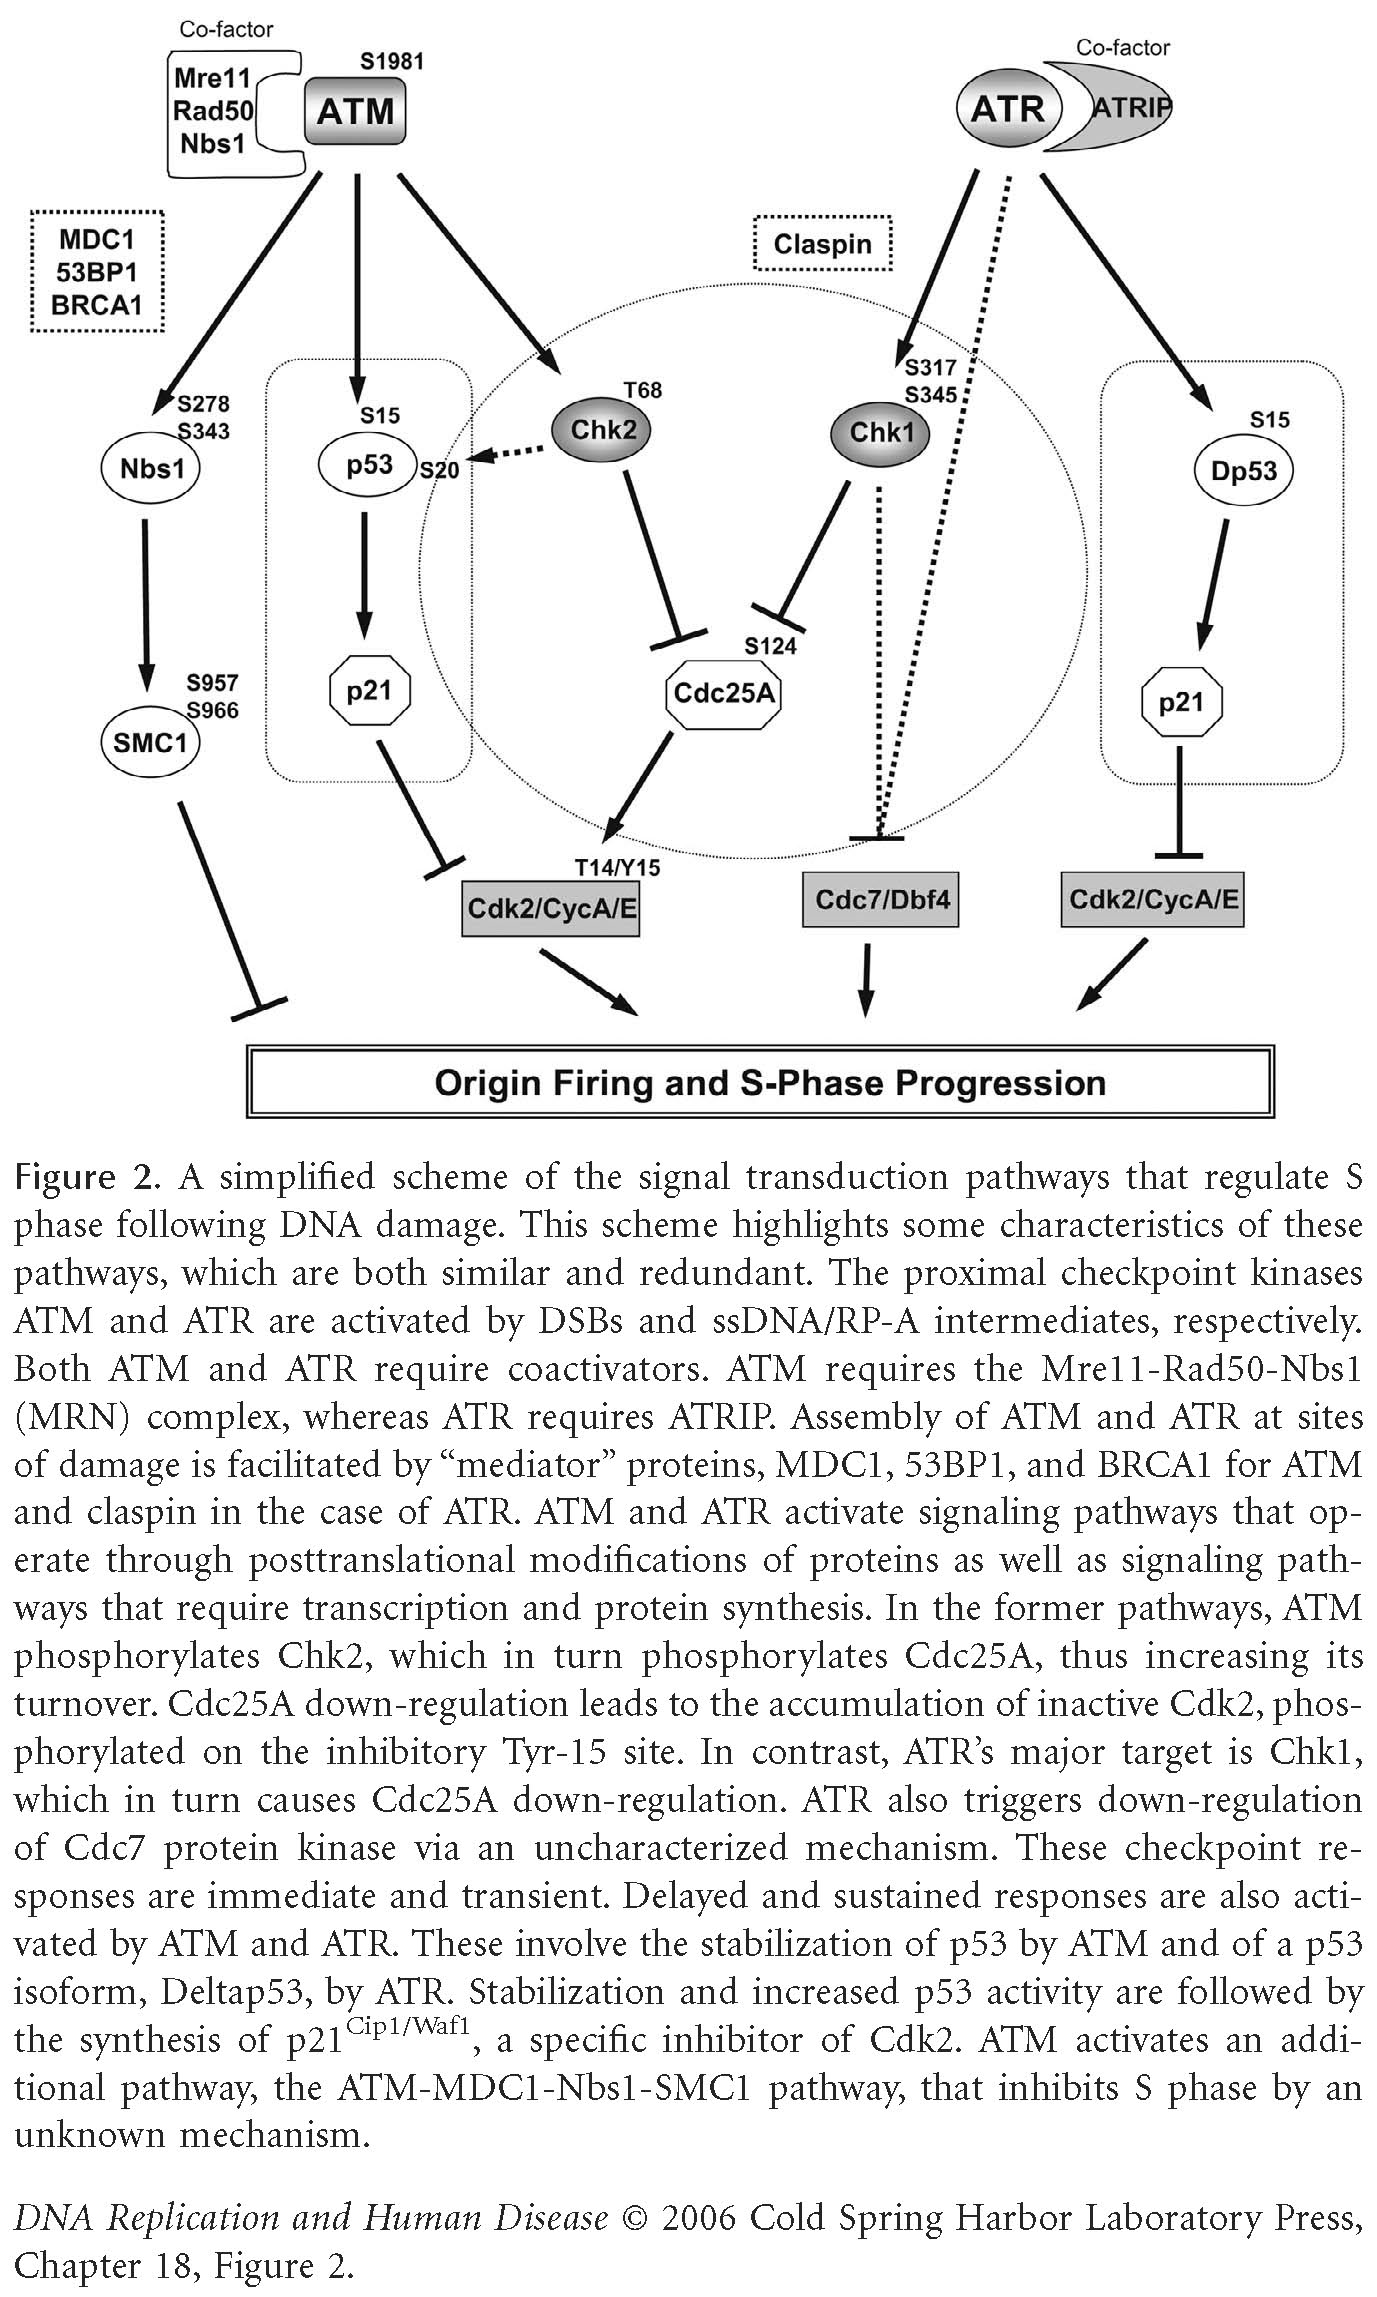
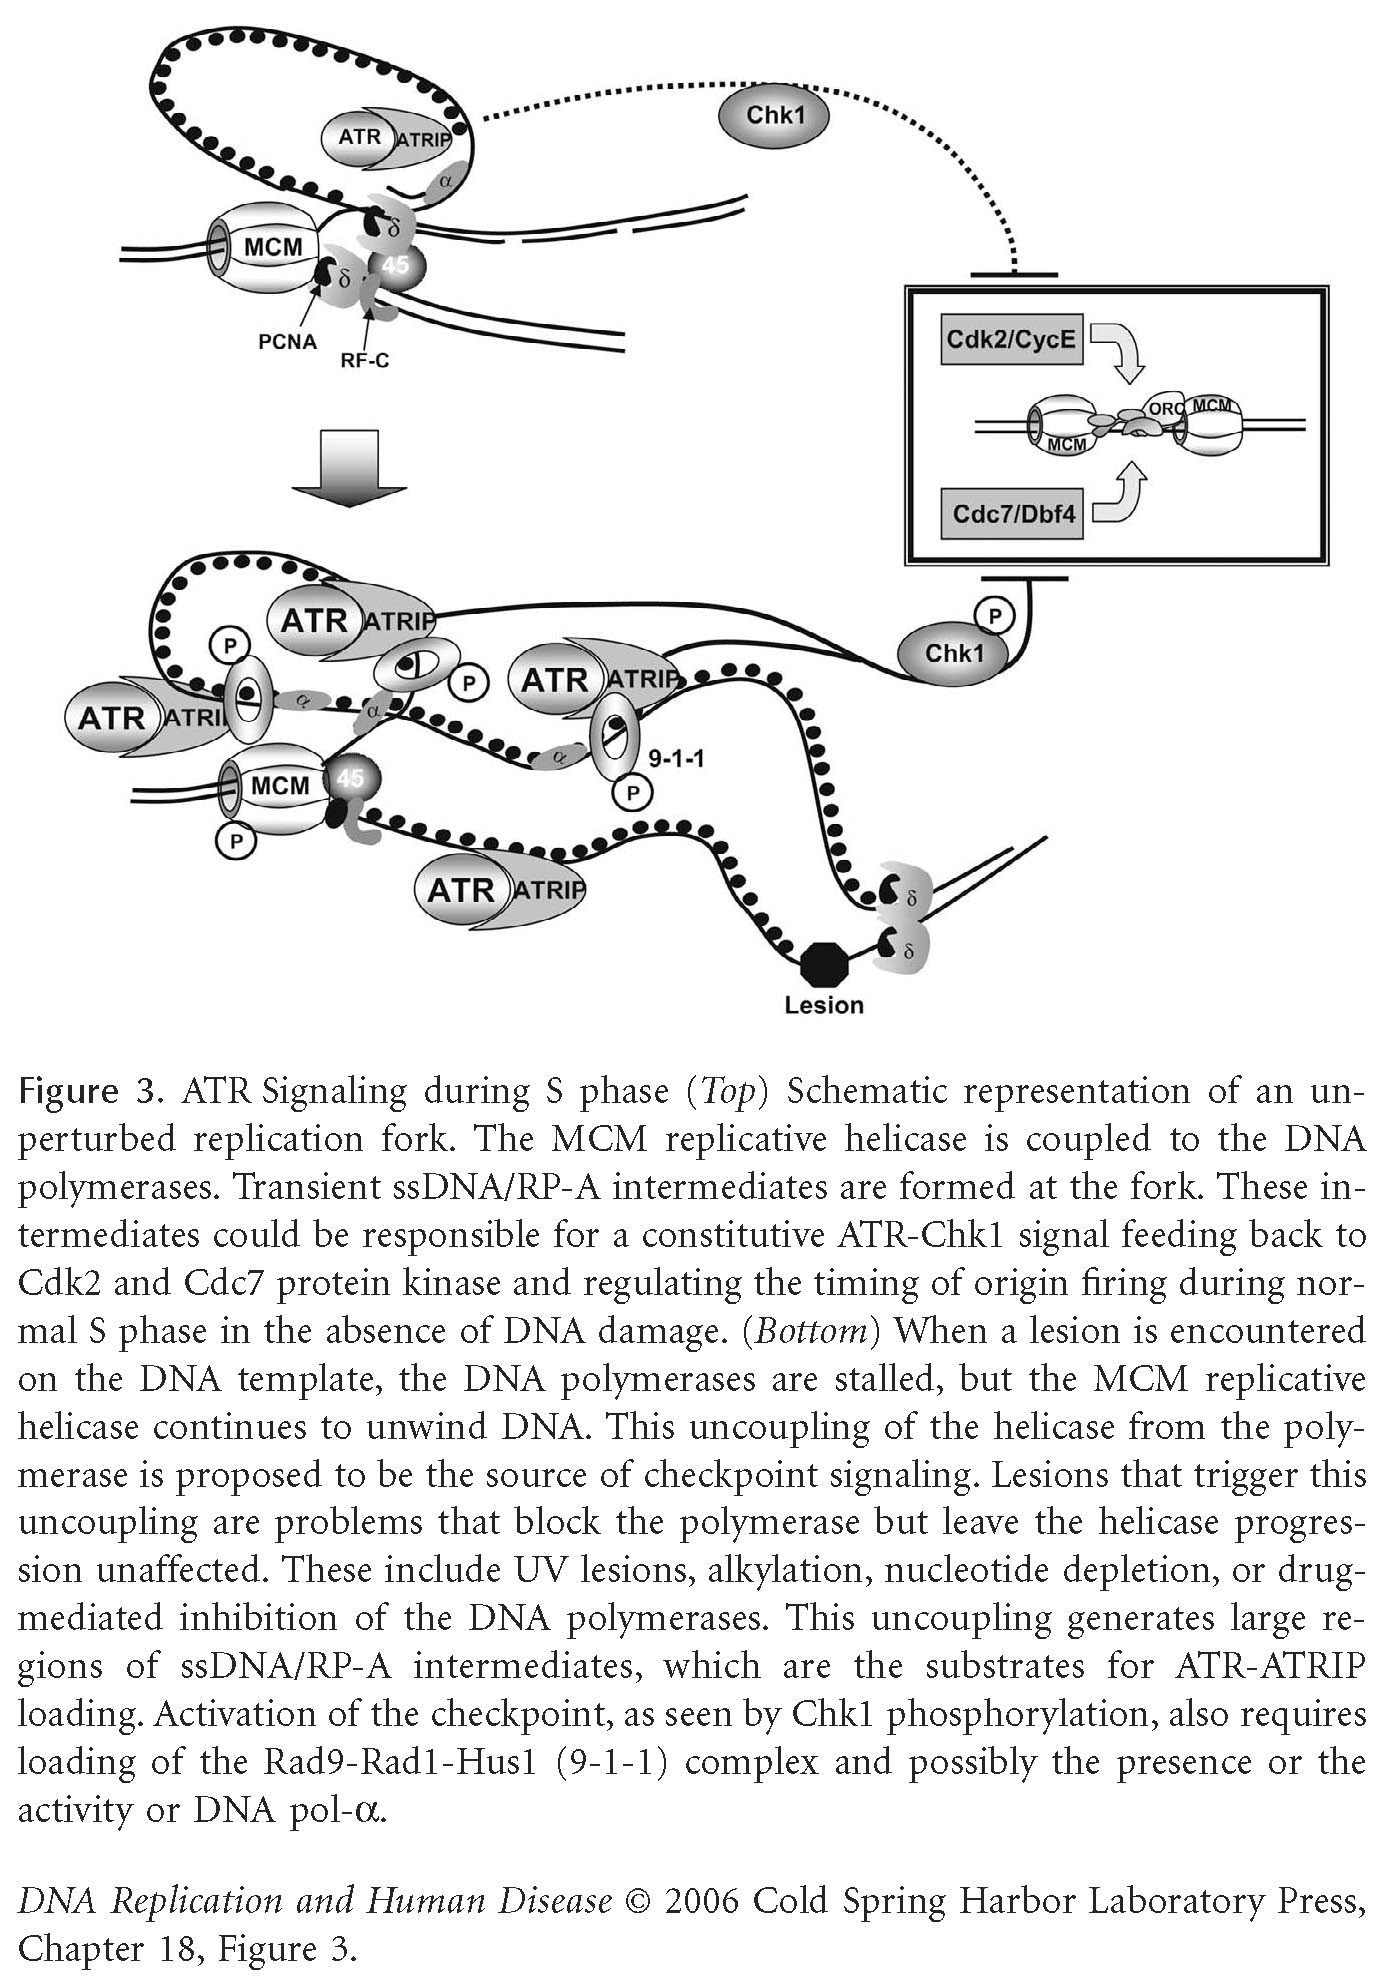
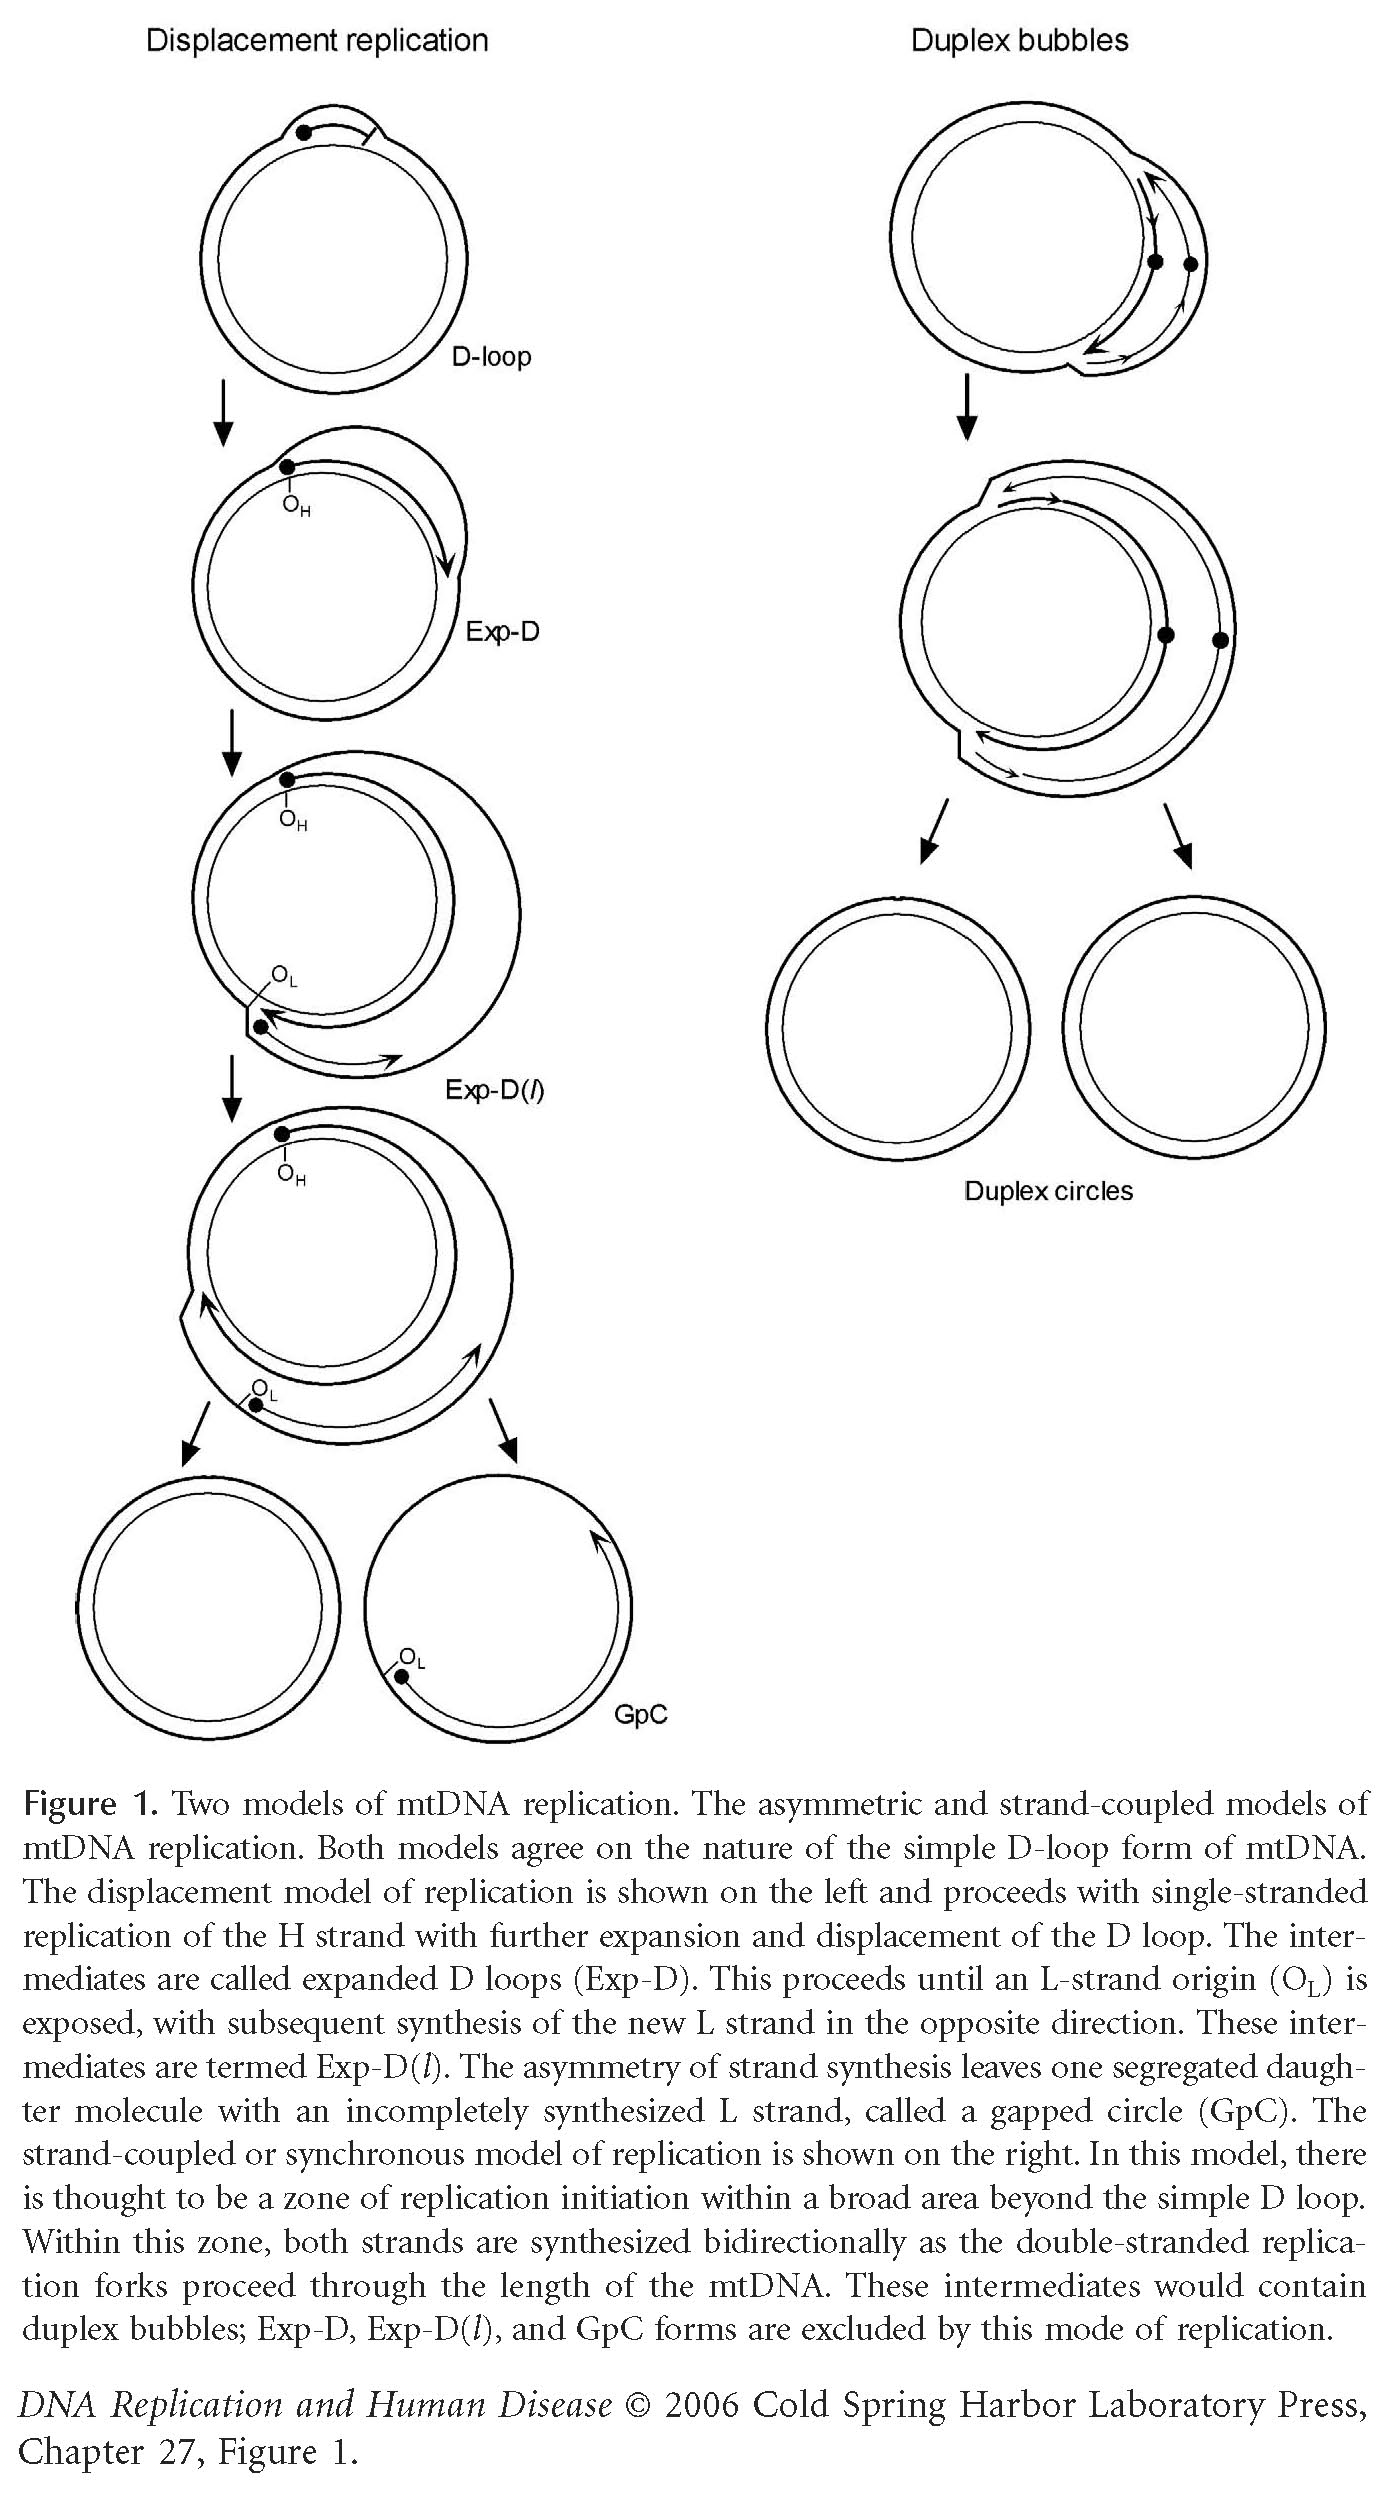
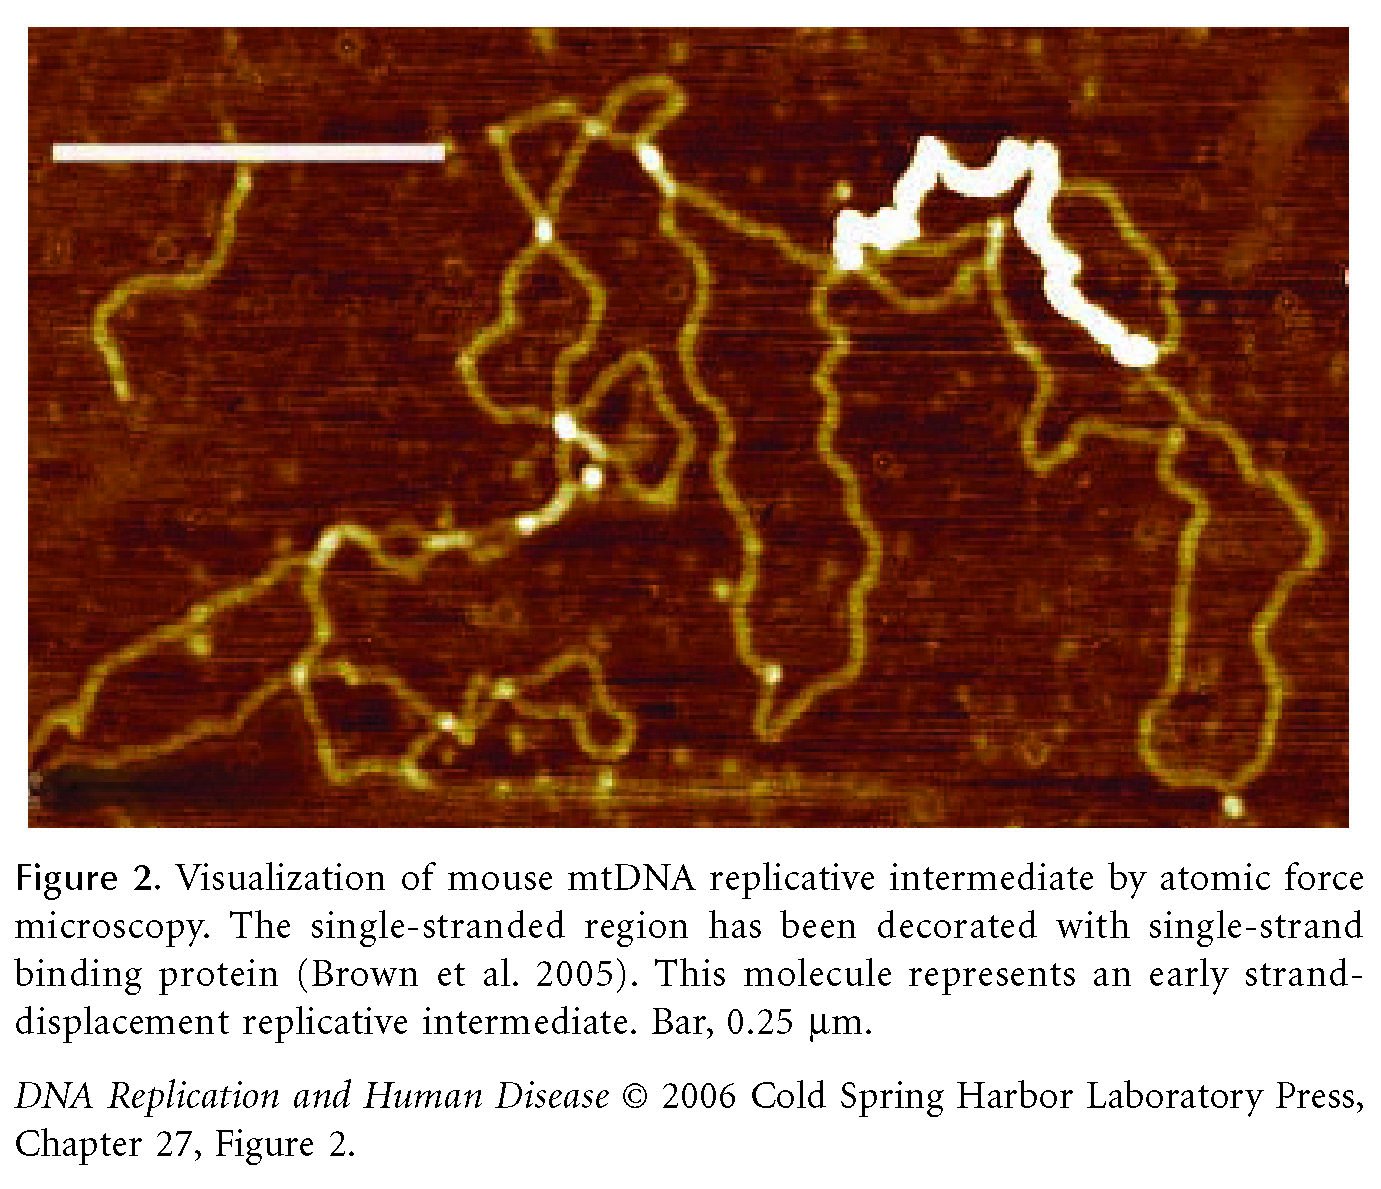
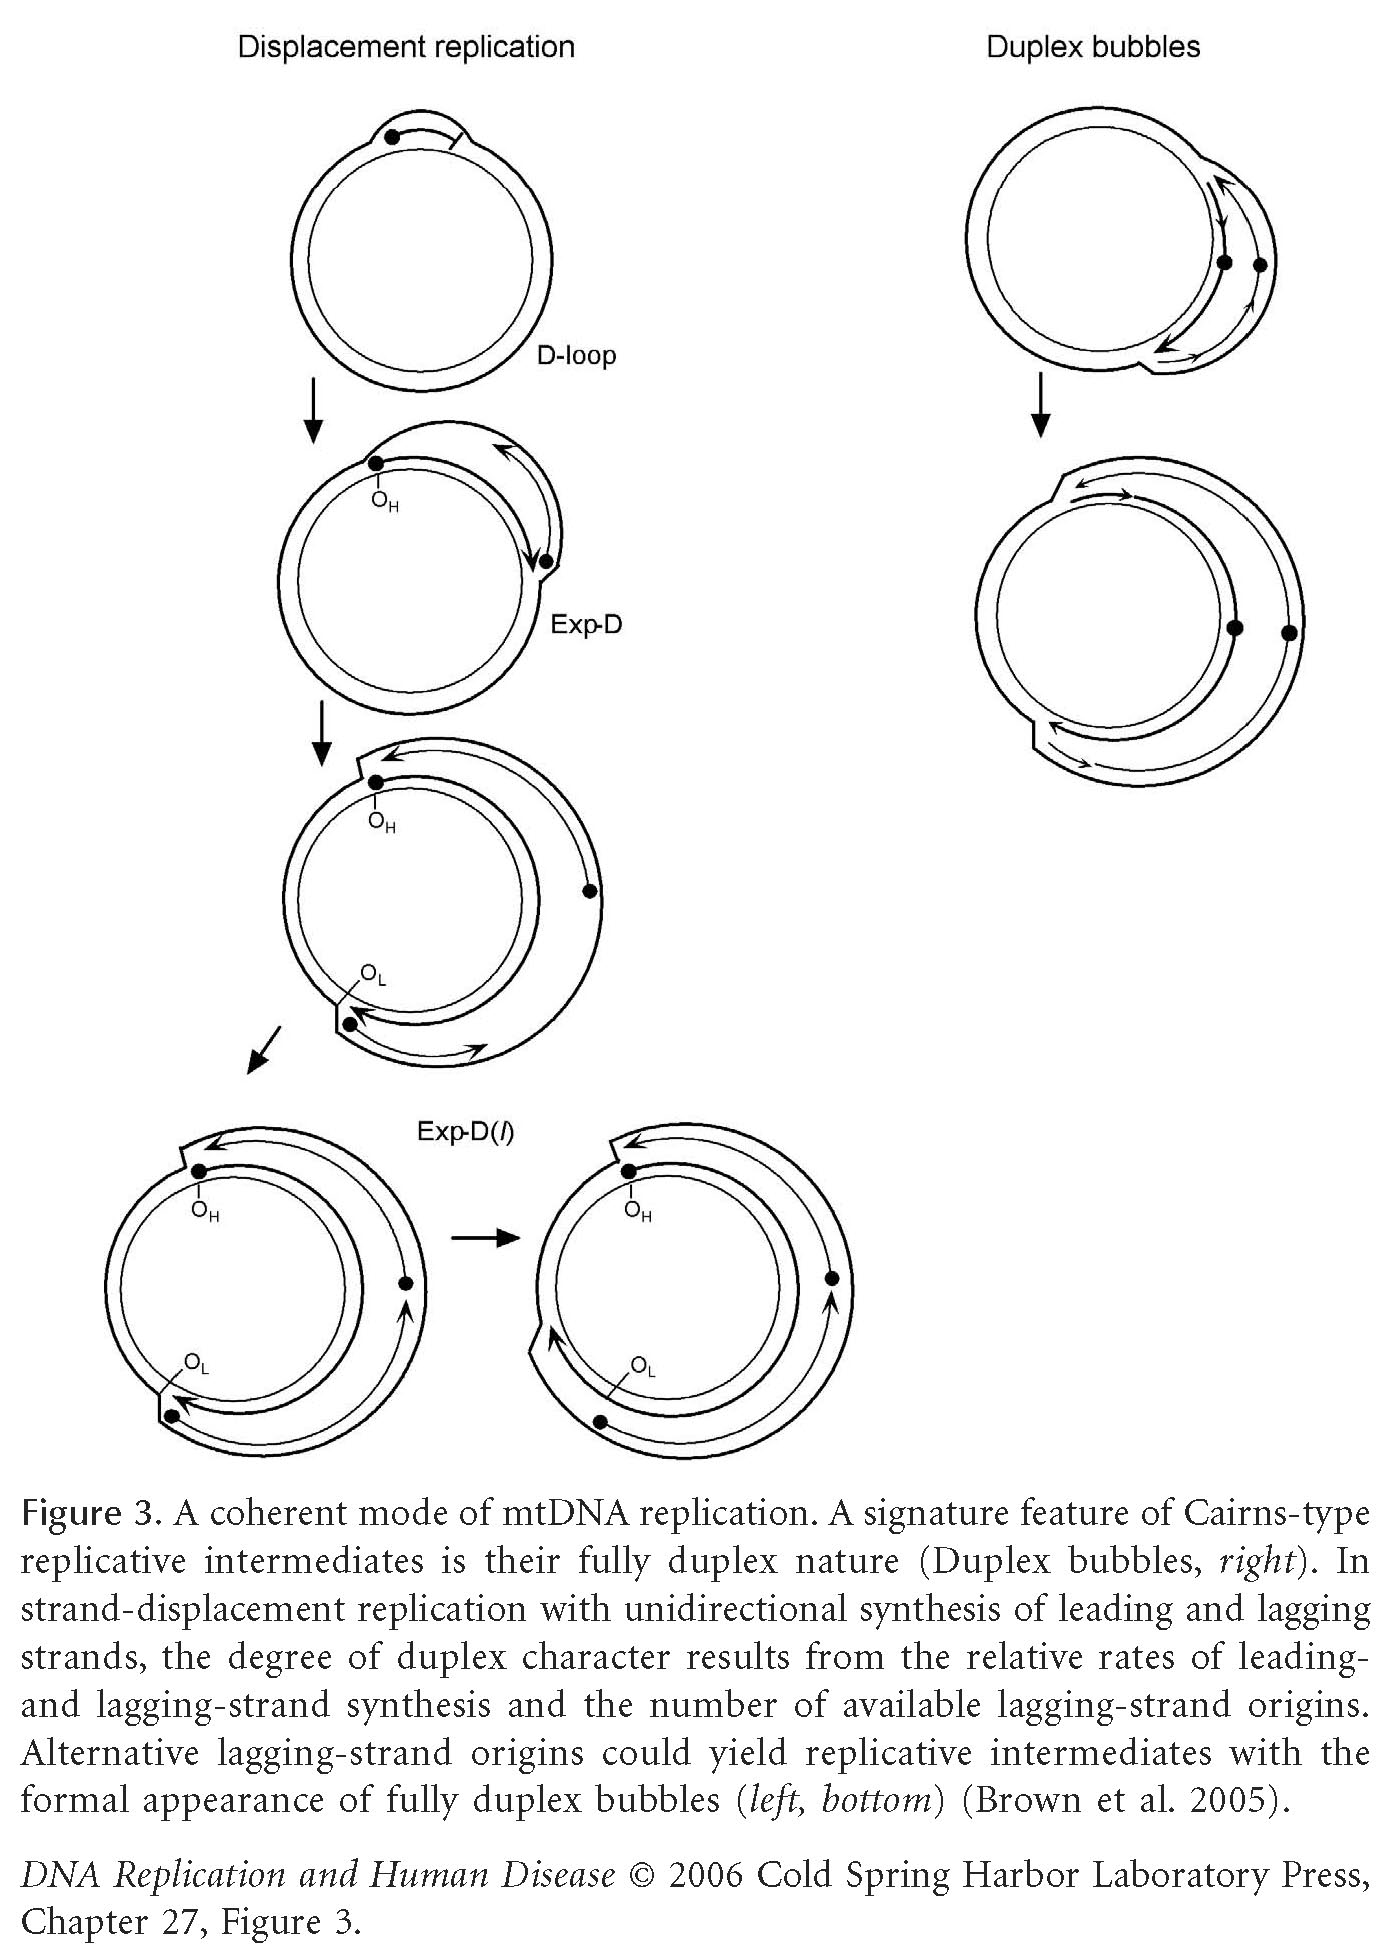
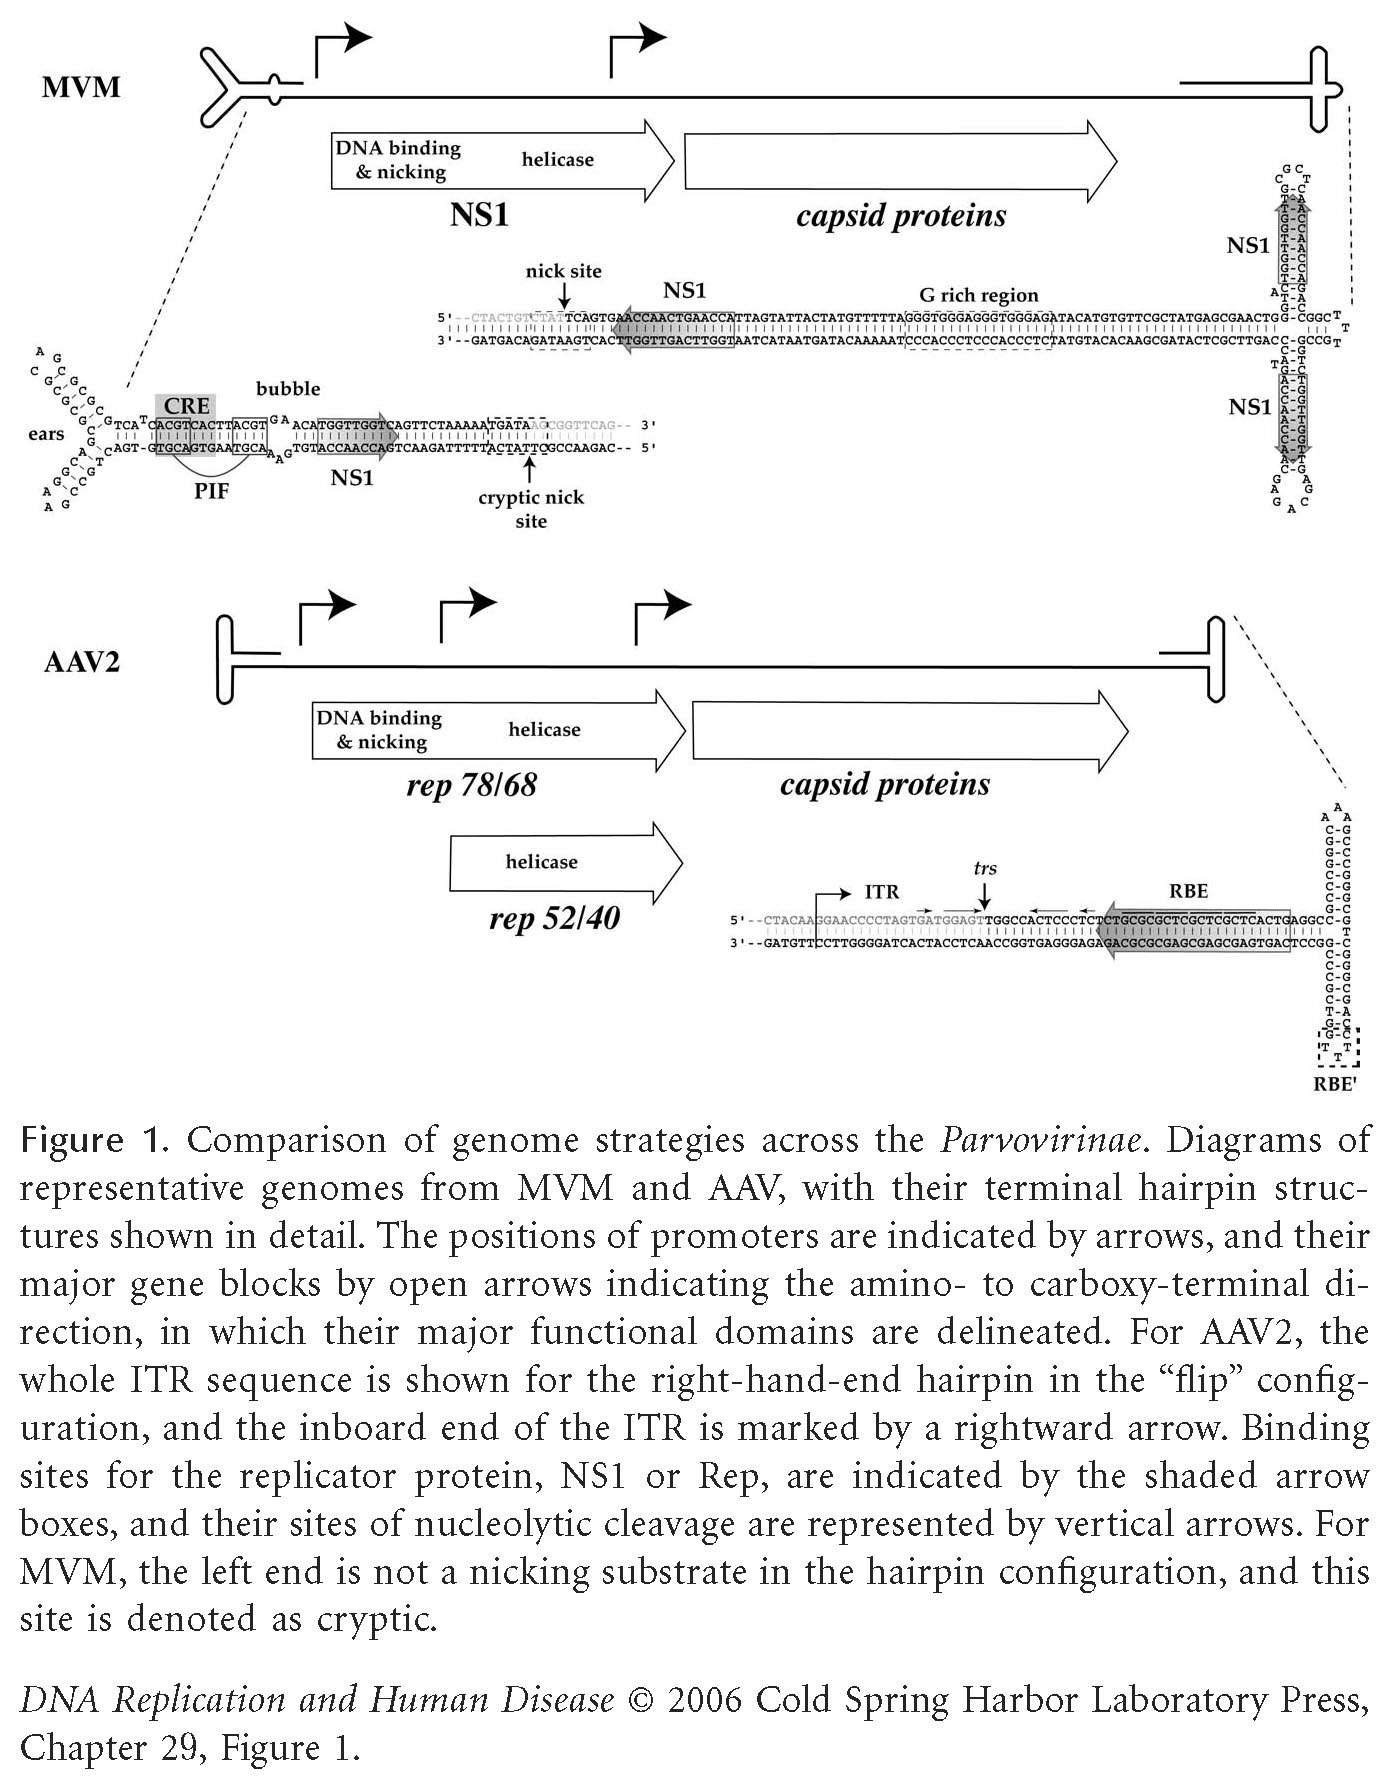
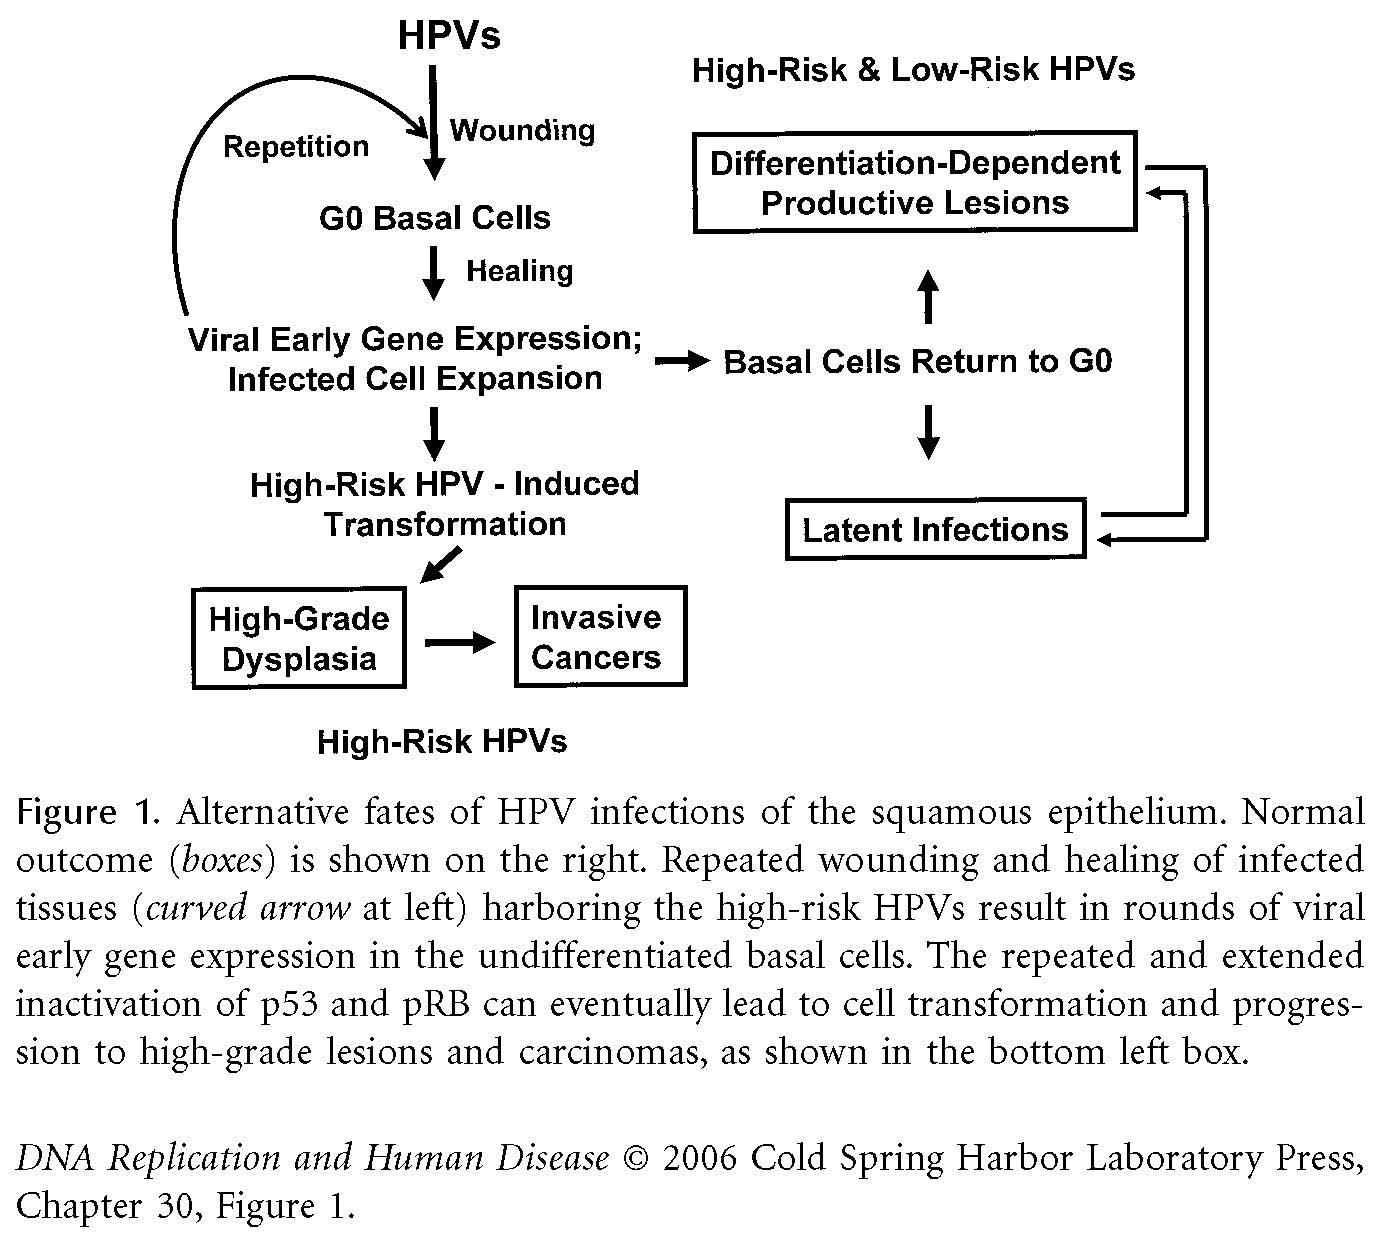
.
. DNA Replication and Human DiseaseCSHL Press .
. . . . .
.
.
.
. .
 
.
. . .
.  FIRST VISIT?
 TRY THESE LINKS
.
. . .
.
.   Registration
  Privacy Policy
  Purchase the book
.
.
 
 
.
. . .
.  BOOK COVER .
. . .
.
. DNA Replication and Human Disease cover .
.
CLICK TO ENLARGE
 
Buy the Book


Figure Menu

Click on the highlighted text below to see the figure.

Chapters 1–4

Figure 1-1. Initiation of DNA replication.

Figure 1-2. DNA relication forks.

Figure 2-1. The replicon model.

Figure 2-2. Functional elements in yeast replicators.

Figure 2-3. Metazoan replication origins.

Figure 2-4. Sequence features of metazoan replicators.

Figure 3-1. Speculative model of pre-RC formation.

Figure 4-1. Mechanism of helicase activation.

Chapters 5–7

Figure 5-1. Eukaryotic DNA replication fork.

Figure 5-2. Subunit interactions in DNA polymerases.

Figure 5-3. Replicative DNA polymerase model.

Figure 5-4. Replication stages of the lagging strand.

Figure 5-5. Nick maintenance by idling or by nick translation.

Figure 6-1. Conservation of the CAF-1 and HIR histone deposition complexes.

Figure 6-2. Histone deposition during DNA replication.

Figure 6-3. Known interaction partners of Asf1.

Figure 7-1. Maintenance methylation of CpG sites.

Chapters 8–10

Figure 8-1. Crystal structure of Tus-Ter complex of E. coli.

Figure 8-2. Repeat units of yeast rDNA.

Figure 8-3. Nucleotide sequences of Ter1 and Ter2 sites.

Figure 8-4. 2D gel analyses of replication fork arrest.

Figure 8-5. Loading of the RENT complex at the rDNA of yeast and of the FEAR pathway.

Figure 8-6. Mating-type switching locus Mat1 of S. pombe.

Figure 9-1. Replication foci.

Figure 9-2. Dual telomere anchoring pathways in yeast.

Figure 10-1. Regulation of origin initiation time in S. cerevisiae.

Figure 10-2. Developmentally regulated replication initiation sites.

Chapters 11–14

Figure 11-1. Changes in origin position related to transcriptional activity.

Figure 12-1. Structure and protein binding at amplification origins.

Figure 12-2. Cell biological assays for amplification in Drosophila.

Figure 13-1. Genetic organization of the four genera of the Geminiviridae family.

Figure 13-2. Initiation reaction and loading of cellular DNA replication factors.

Figure 14-1. Sulfolobus origin architecture and recognition by Orc1/Cdc6 homologs.

Figure 14-2. Mechanisms by which replicative helicases may function.

Figure 14-3. Archaeal MCM organization.

Figure 14-4. Uracil-binding pocket.

Figure 14-5. Human PCNA bound to FEN1.

Chapters 15–17

Figure 15-2. Chromosome replication cycle.

Figure 15-3. CDK activity prevents pre-RC assembly.

Figure 16-1. Regulation of ORC activity in mammal and fly.

Figure 16-2. Regulation of ORC activity in X. laevis.

Figure 16-3. Regulation of Cdc6 activity in metazoa.

Figure 16-4. Regulation of Cdt1 and MCM activity in metazoa.

Figure 16-5. Structure of a geminin:Cdt1 complex.

Figure 17-1. Checkpoint pathways in budding and fission yeasts.

Figure 17-2. Multiple potential configurations of stalled replication forks.

Figure 17-3. Sister chromatid junctions that resemble hemicatenanes.

Figure 17-4. Bypassing damage in the template strand.

Chapters 18–22

Figure 18-1. The different checkpoints operating in S phase.

Figure 18-2. Signal transduction pathways that regulate S phase.

Figure 18-3. ATR signaling during S phase.

Figure 20-1. Putative roles of DNA polymerases in DNA transactions.

Figure 20-2. Structures of DNA polymerases in five families.

Figure 21-1. The protein networks that ensure genomic stability on eukaryotic clamps.

Figure 21-2. Four clamp–clamp loader pathways in eukaryotes.

Figure 22-1. Active mechanisms of helicase unwinding.

Figure 22-2. Functional motifs in XPB and XPD helicases.

Figure 22-3. Alignment of RecQ family helicases.

Chapters 23–26

Figure 23-1. Disease-associated unstable repeats.

Figure 23-2. DNA metabolic processes and repeat instability.

Figure 23-3. Replication and repeat instability.

Figure 23-4. Replication-mediated TNR instability.

Figure 23-5. trans-factors and repeat instability.

Figure 25-3. Dual immunofluorescence staining for Ki67 and other cell cycle markers.

Figure 26-1. Action of commonly used DNA replication inhibitors.

Figure 26-2. Action of purine and pyrimidine biosynthesis inhibitors.

Figure 26-3. Action of DNA polymerase inhibitors.

Figure 26-4. DNA alkylation by MMS.

Figure 26-5. DNA alkylating drugs.

Figure 26-6. Topoisomerase inhibitors.

Figure 26-7. Common inhibitors of Cdks and checkpoint inhibitors.

Chapters 27–30

Figure 27-1. Two models of mtDNA replication.

Figure 27-2. Mouse mtDNA replicative intermediate.

Figure 27-3. A coherent mode of mtDNA replications.

Figure 27-4. Aging phenotypes in mtDNA-mutator mice.

Figure 28-3. Telomere replication and telomerase-mediated extension.

Figure 29-1. Genome strategies across the Parvovirinae.

Figure 29-2. Encapsidation strategy for MVM.

Figure 30-1. Fates of HPV infections of the squamous epithelium.

Figure 30-2. HPV/host interactions in differentiated keratinocytes.

Figure 30-3. Clonal selection for an HPV-transformed cell.

Figure 30-4. How E2 protein might destabilize host chromomes.

Chapters 31–36

Figure 31-1. Tag structural domains.

Figure 31-2. Tag interactions with host proteins.

Figure 32-2. Adenovirus DNA replication.

Figure 33-1. HSV-1 genome and origins of replication.

Figure 33-2. UL9-dependent and UL-9-independent HSV DNA replication.

Figure 34-1. B95-8 laboratory strain of EBV DNA of 165 kbp.

Figure 34-2. oriP and EBNA1.

Figure 34-3. oriLyt and its expanded core domain.

Figure 36-1. The hepatitis B virus genome.

Figure 36-2. Replication cycle of a hepadnavirus.

Figure 36-3. Priming of minus-strand DNA.

Figure 36-4. Priming of plus-strand DNA synthesis.

Appendices

Figure 1A-1. Map symbols.

Figure 1A-2. Examples of MIMs.

Figure 1A-3. MIM of the signal transduction network that regulates the onset of DNA replication.

Figure 1B-1. Origins of the components of the pre-RC.


. .